


RESUME - Project overview
Jump to: SOLUTION -Project implementation
Skills & Concepts demonstrated
The data source is Excel workbook containing results of Data Professionals survey (Dataset
available on GitHub repository)
. The results will be analyzed using Power BI and the required insights will be provided using various visualizations. Survey was anonymous and survey takers provided information about country they come from, their role, salary, job satisfaction etc.
The
final Dashboard built in Power BI
is available on GitHub repository.
Problem Statement
There is survey made in June 2022 on Twitter and LinkedInd among professionals in Data Business. The survey was created and conducted by Alex The Analyst, who has publicly provided a dataset of the survey results that will be used in this project.
There are following questions asked in the survey:
Q1 - Which Title Best Fits your Current Role?
Q2 - Did you switch careers into Data?
Q3 - Current Yearly Salary (in USD)
Q4 - What Industry do you work in?
Q5 - Favorite Programming Language
Q6 - How Happy are you in your Current Position with the following?
A) Salary, B) Work/Life Balance, C) Coworkers, D) Management, E) Upward Mobility, F) Learning New Things
Q7 - How difficult was it for you to break into Data?
Q8 - If you were to look for a new job today, what would be the most important thing to you?
Q9 - Male/Female?
Q10 - Current Age
Q11 - Which Country do you live in?
Q12 - Highest Level of Education
Q13 - Ethnicity
There are 5 business questions that need to be answered based on insights obtained in Data Analysis of the Dataset.
Skills & Concepts demonstrated
There are following Power BI features used in this project
There are following insights needed to be obtained:
Questions
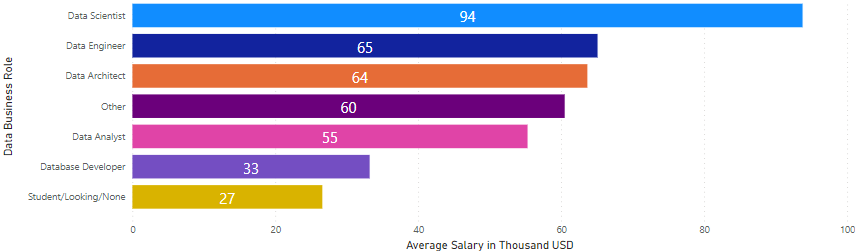
1-What are the Top 3 Data Business roles with the highest salary? What is the position of the role of Data Analyst?
2-Which are the Top 5 programming languages used by Data Professionals?
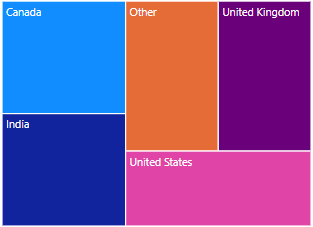
3-How many survey takers are there, and which are the top 3 countries with percentage?
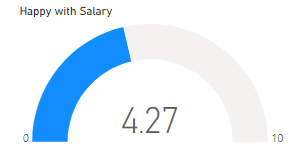
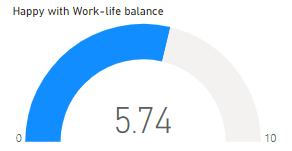
4-What is average rating of hapiness with salary and work-life balace?
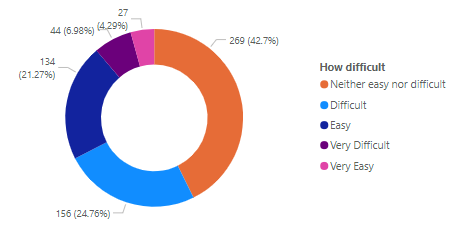
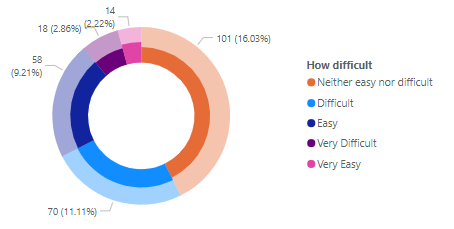
5-What are answers regarding difficulty of break into data, overall and in particular in USA?
Insights
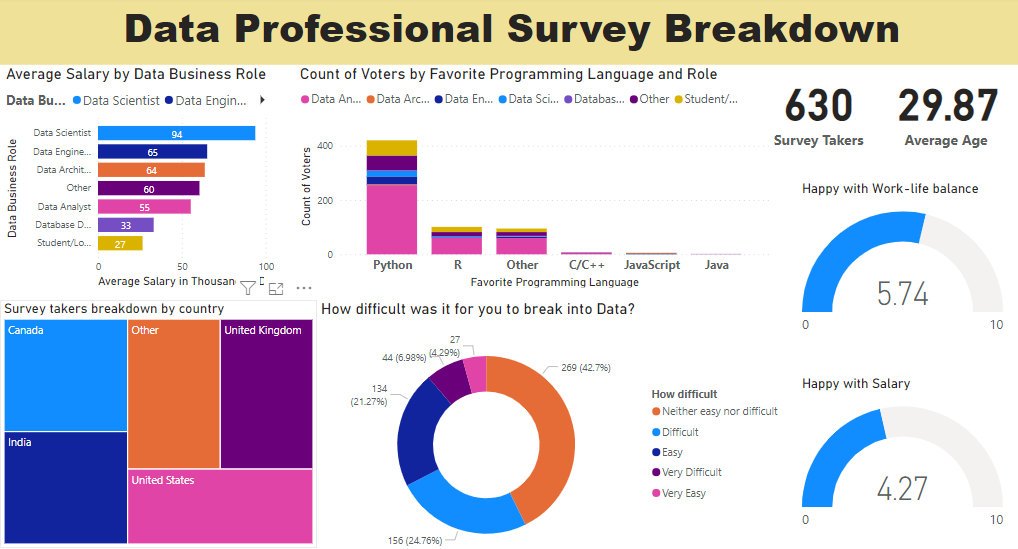
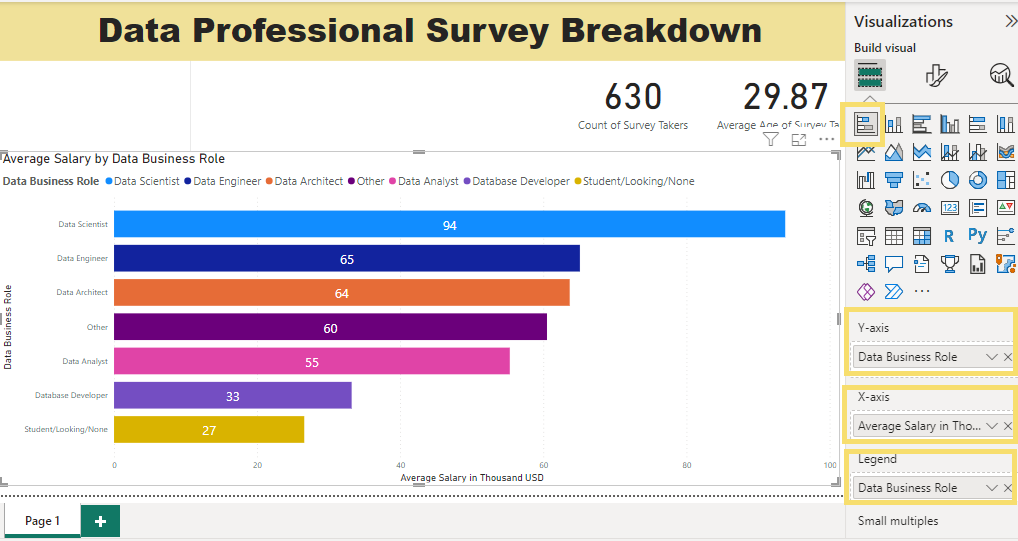
1. There is the highest average salary in the role of Data Scientist, followed by the role of Data Engineer and the Data Architect roles. The role of Data Analyst is in the 5th position
2. The most popular programming languange in Data Business is Python, followed by R on the 2nd place. After the group of other programming languages (DAX/Excel/SQL/none) on the 3rd place, the 4th place belongs to C/C++ followed by JavaScript on the 5th place


3. There are in total 630 unique survey takers from many different countries. The most survey takers are form Canada, UK and India, in total 60%.
4. With the range of offered rating from 0 to 10, the average voted rating of the happiness with the salary is 4.27 and the average voted rating for the happines with the work/life balance is 5.74
5. The most survey takers (43%) see the difficulty of break into the data neither easy nor difficult (16% for USA). The signifficant part (25%) see this process difficult (11% for USA), while there is a little lower number of participants (21%) who consider this process as Easy (9% for USA). There is around 10% of participants that consider he difficulty of break into the data either very difficult (a bit more within this group) or very easy (5% in both groups total for USA).
SOLUTION - Project implementation
Back to: RESUME -Project overview
0.1-Brief Data Overview
0.2-Data Preprocessing
0.3-Importing Data from Excel
0.4-Data Cleaning
0.5-Data Transformation
1-Average salary by Data Business Role
2-Top 5 programming languages used by Data Professionals
3-Survey taker count and top countries they come from
4-Rating of hapiness with salary and work-life balace
5-Difficulty of break into data
The raw data model is in an Excel file, available on GitHub Repository . After brief data overview and data preprocessing, data will be imported to Power BI.
0.1-Brief Data Overview
The data model is an Excel workbook containing 1 worksheet. There are 630 rows plus header as well as 28 data columns.
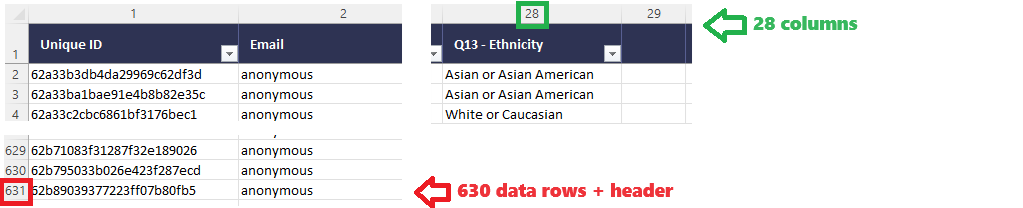
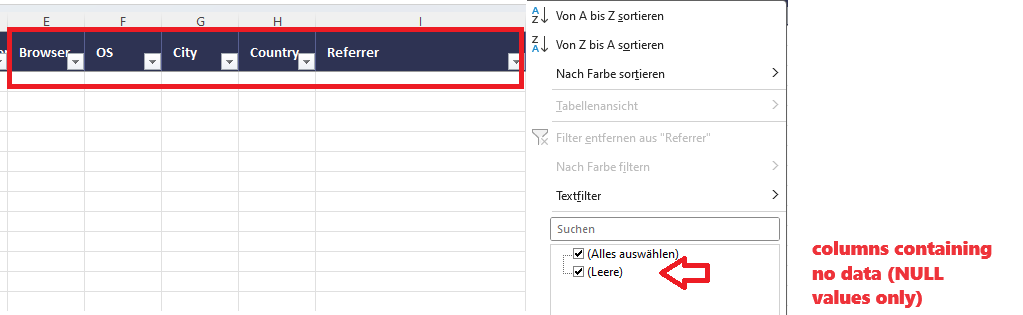
In the brief data overview there were observed some columns that have no values. These columns will be removed in Power BI within Data Cleaning process.
0.2-Data Preprocessing
There is a Date column that contains American formatted date (MM/DD/YYY) , that may lead to Errors when importing in Power BI. The easiest way is to test success of import for dates that have day higher than 12, to avoid confusion by mixing months and days. The test shown that Power BI was not able to recognize the date properly.
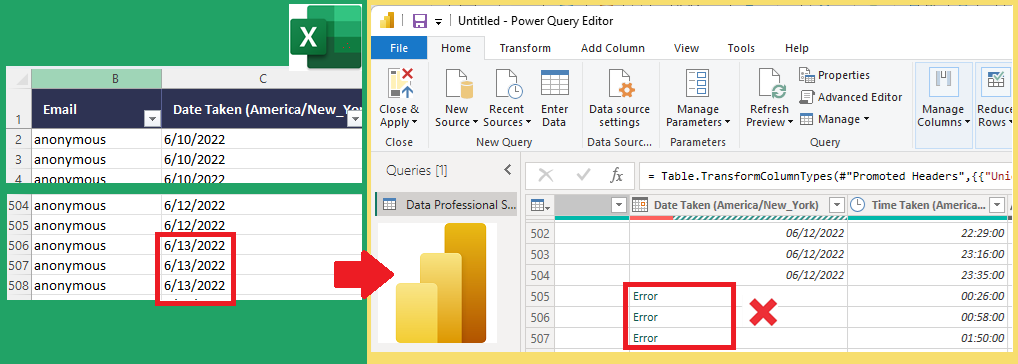
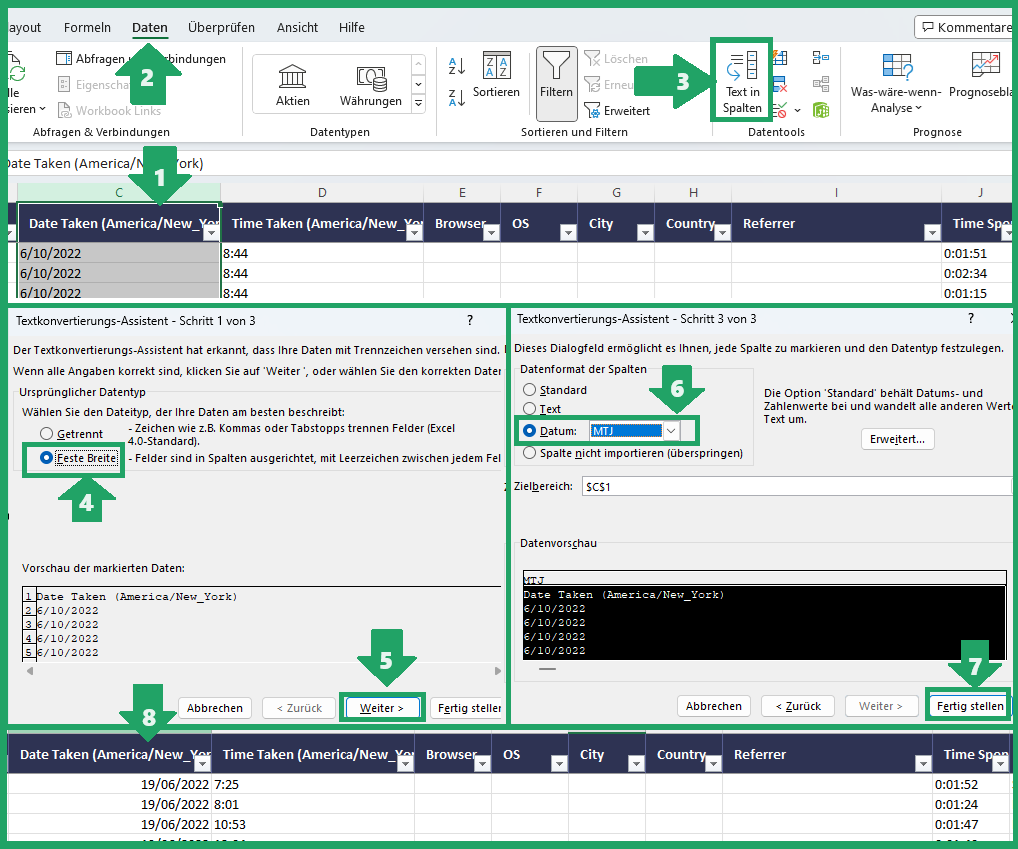
So this date column has to be converted before importing to Power BI, to the proper European date format (DD/MM/YYY). The procudere is shown in the image below: First select (1) the entire Date column and under Data option (2) in menu (Daten) select Text To Columns (3) button (Text in Spalten). In the steps following it has to be set (4) that no new columns needed to be created (Feste Breite) and for Date format it has to be selected the current date format (6) which is MDY=MonthDayYear (MTJ=MonatTagJahr). After conversion is done the Date column (8) is ready to be imported properly
0.3-Importing Data from Excel to Power BI
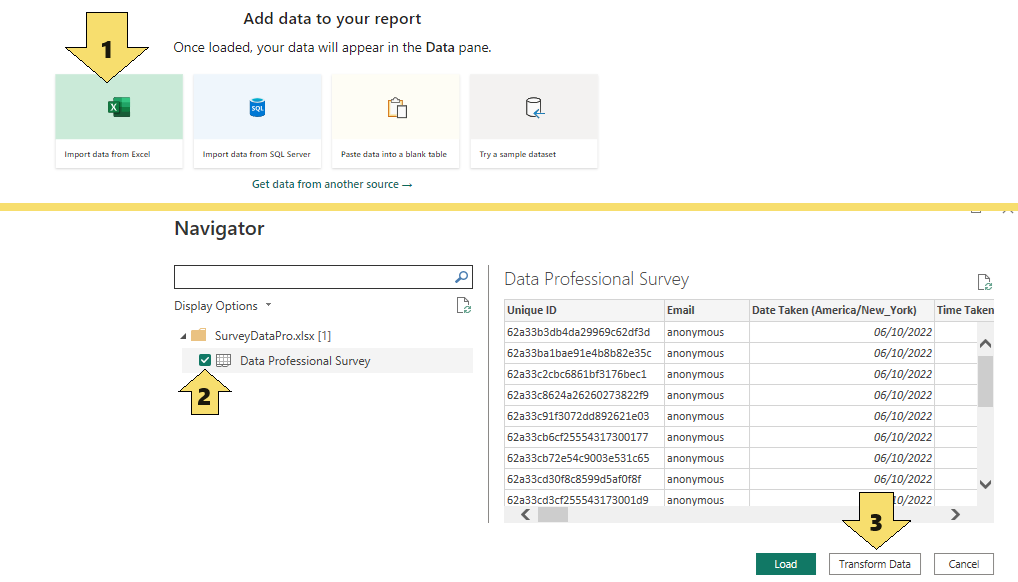
The first step is select option (1) Import data from Excel on the initial menu in Power BI. After importing, Power BI will show recognized data tables on the right side, and it has to be selected the one need (2). Since the next step is data cleaning and transformation, the option to be selected is Transform Data on the button right down (3)
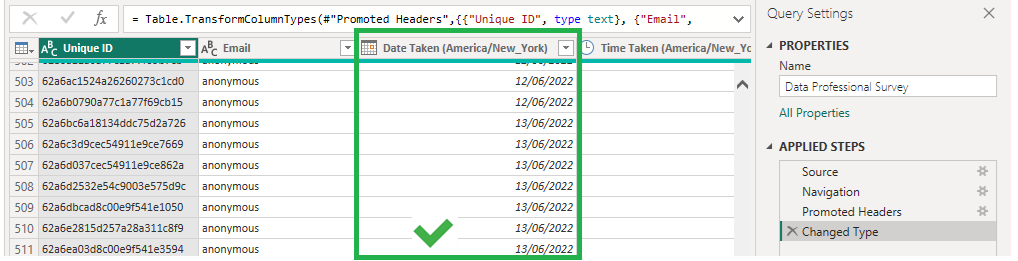
Since Date column was transformed to proper format during Data Preprocessing, it is imported successfully as expected, shown in the image below:
0.4-Data Cleaning
In the Data Cleaning process there will be removed columns containing NULL values as well as duplicate rows, if any.
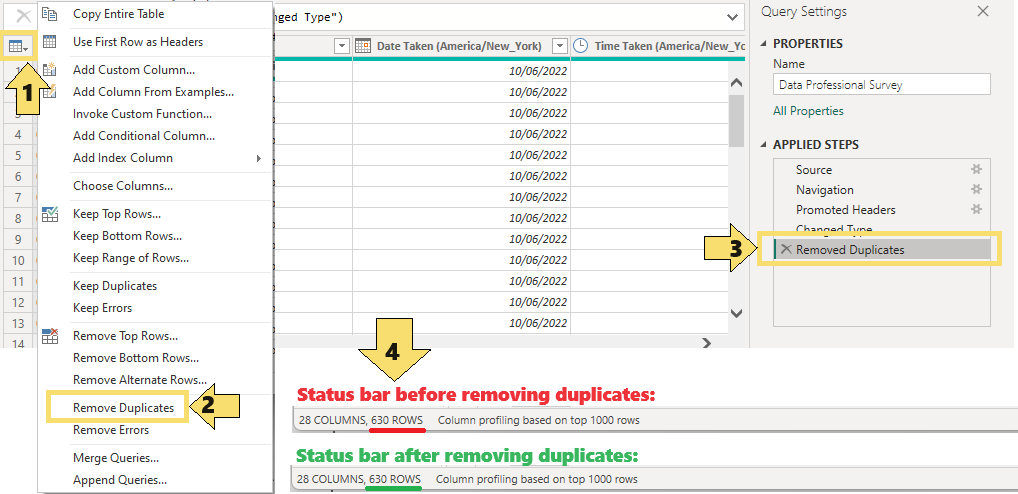
Removing duplicates starts by clicking in the top left corner (1) which opens a menu in which it has to be selected Remove Duplicates item (2). After action applied it will be shown in the Applied Steps section (3). The number of removed duplicate rows is the difference of the row count before and after duplicate removing, shown in the Status Bar (4). In our data model there were no duplicates, since the row count remained the same.
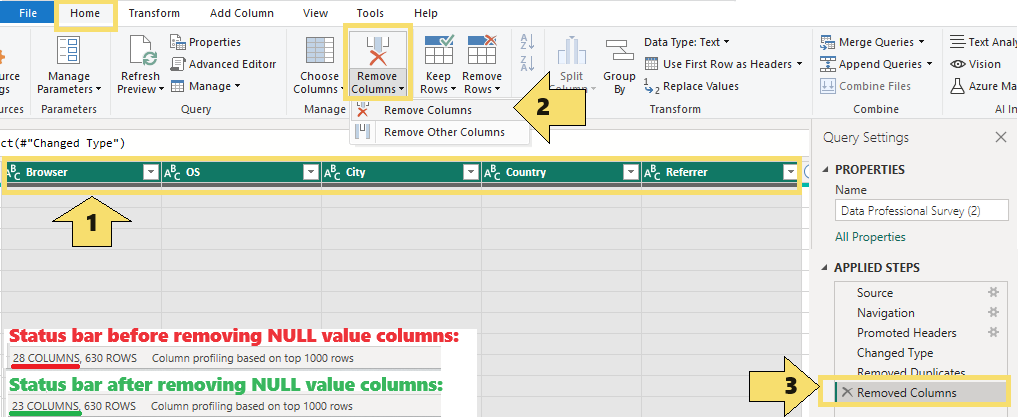
For Dropping NULL value columns it will be used information observed during brief data overview. There are columns 'marked for deletion' since they contain no values. After selecting columns to be removed (1) it has to be selected Remove columns button (2) within Home menu option and this step will be afterwards shown in Applied steps list (3)
0.5-Data Transformation
There are string columns that will be split to accomplish more usable data values. Column containing Salary range as text will be converted to numerical average value.
String column transformation
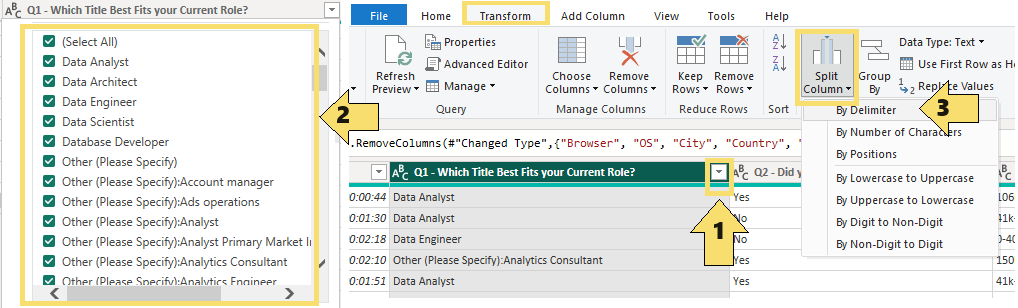
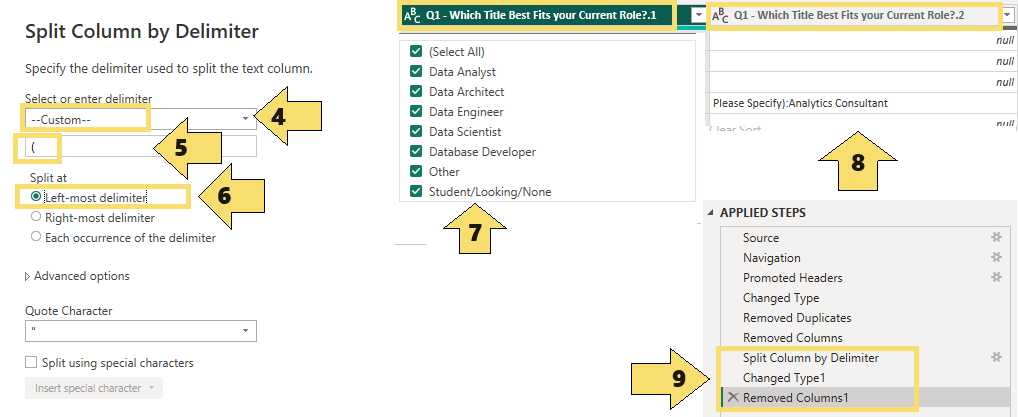
The first column taht will be transfomerd is Current Role. Since there are many different entries as 'Other' it makes sense to unify them all into one category. It will be done using Split column funtionality. Click on the button in the right of the column header (1) there will be shown unique column value list (2). Proceeding is done by selecting option Split column by delimiter(3) within Transform menu option
In the Split column dialog box the following steps are to be applied: From the dropdown-list select the option Custom (4) and specify delimiter (5) which is left parenthesis. Since we need one split, it is selected radio button Left-most delimiter (6). After splitting there are 2 columns, and column 1 now contains clean value Other (7) as expected. The column 2 is not needed anymore (8) and can be removed. Both steps - splitting and removing - are afterwards shown in Applied steps list (9)
The same splitting procedure will be done on 3 more columns: Industry, Programming language and Country. There is colon delimiter in Programming language column so it can be selected from the drop-down list in Split column dialog box.
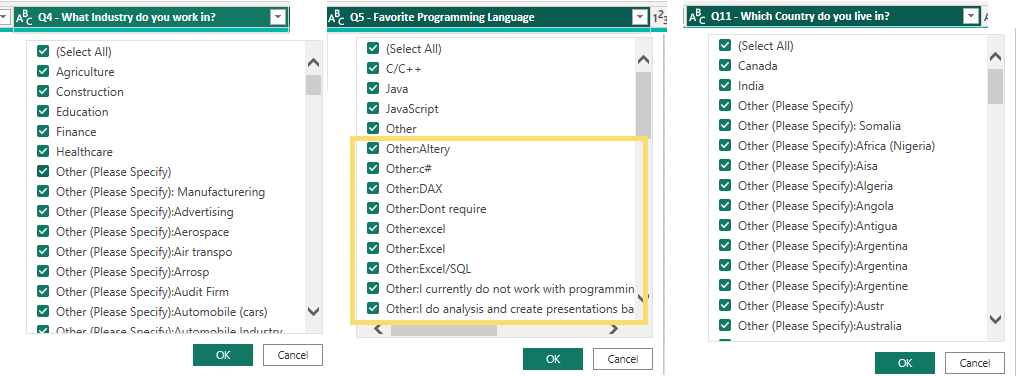
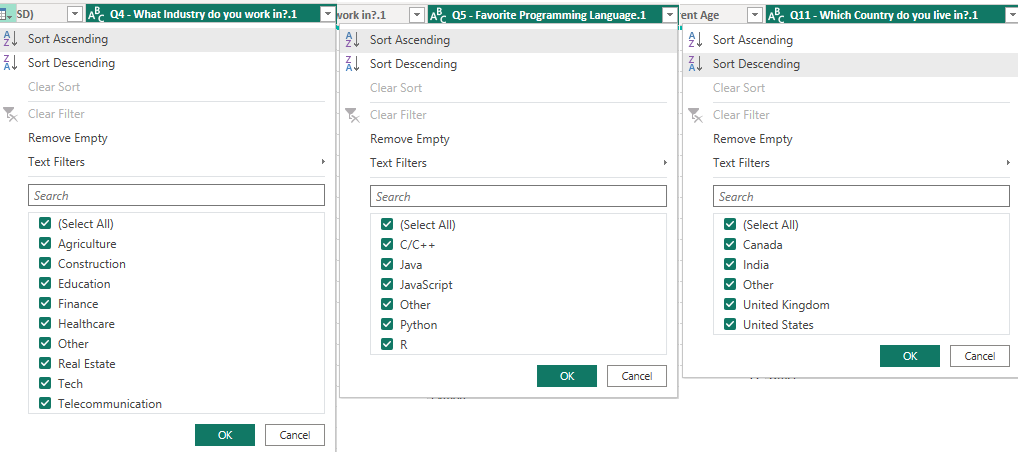
After splitting, these 3 columns contain consistent and reasonable data: either specific information or 'Other':
Transformation of string column that contains numerical data
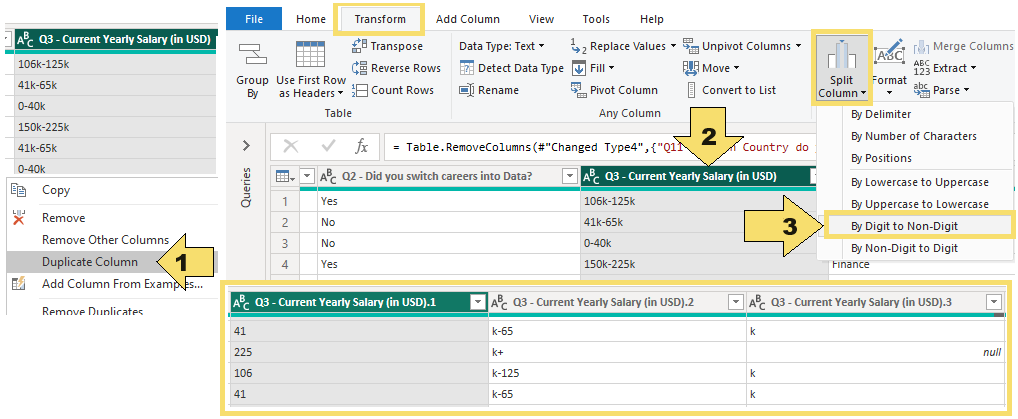
There is a salary column in string format and so unusable for comparison, sorting or other numerical operations. In survey question the salary was presented to participants as a range. This column will be transformed from range (in string format) to the average value (in numerical format) with an exception of the highest salary range presented as 225+ which will be converted to 225. As the first step, Salary column will be duplicated(1) and then split into 2 columns containing the lower and upper limit of the range, first by selecting new copy of the column (2) and then using By Digit to Non-Digit option (3) in Split Column context menu within Transform menu item. After splitting it into digit and non-digit column there will be 3 columns, according to initial column content:
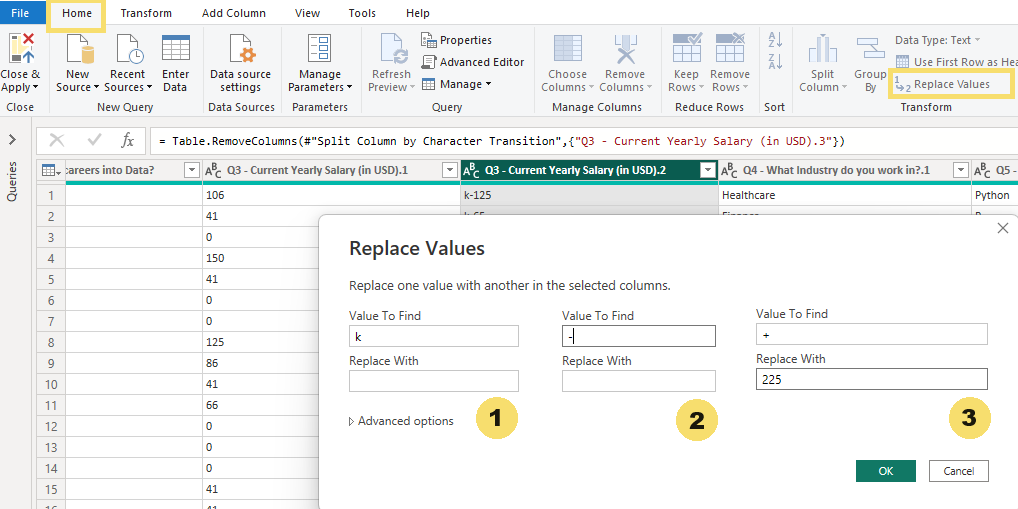
The third column shown above will be completely removed, and in the second column non-digit characters will be deleted using replace by nothing function, and + sign of the 225+ salary will be replaced by 225, as explained previosly:
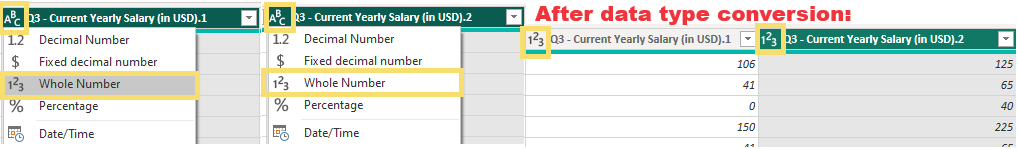
Now there are 2 columns containing numerical data but still in string format, so before calculating average value as per request, columns have to be converted to numerical data type:
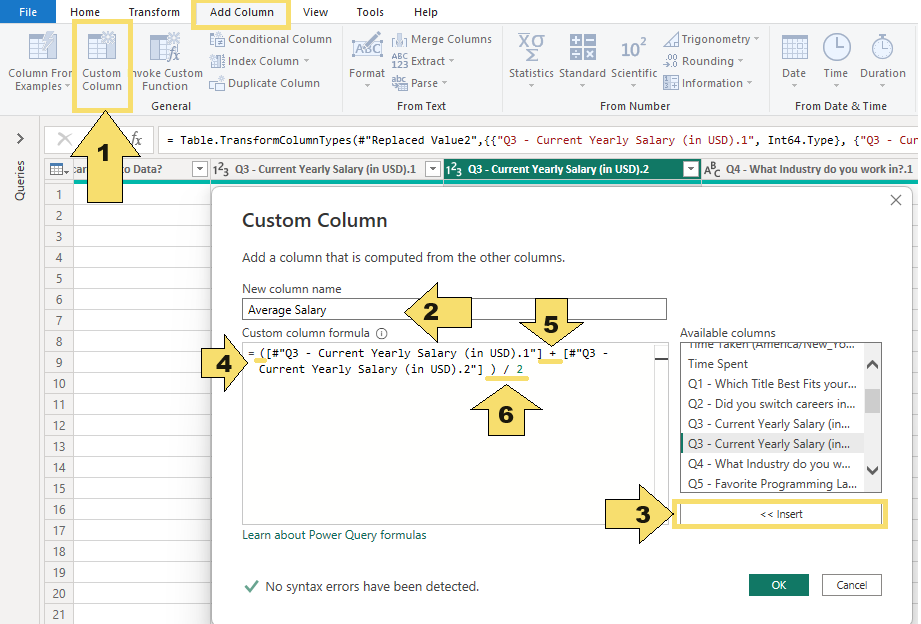
Adding new column will be done using Custom Column button (1) from Add Column menu item. In the dialogue box new column name will be defined by typing it in the New column name field (2), columns will be inserted by selecting column from the list and using Insert button (3). Finally, DAX formula will be edited manually by adding open parenthesis at the beginning (4), plus operator between columns (5) and closed parenthesis, division operator and 2 as divisor at the end (6)
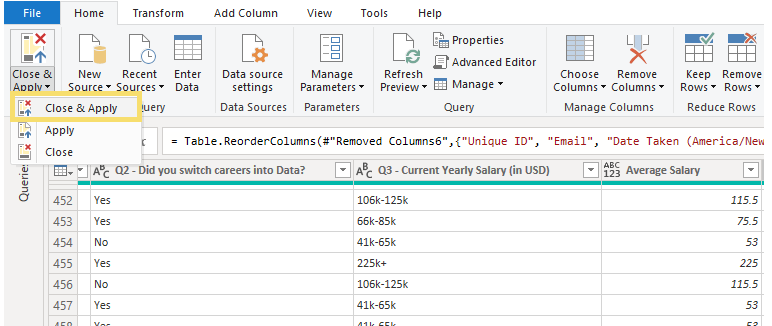
After adding custom column with average salary, two columns containing range limits will be removed and there will be left only initial string salary column containing salary range and calculated average salary column.
Now data transformation is done, and changes will be applied using Close & Apply button
1-Average salary by Data Business Role
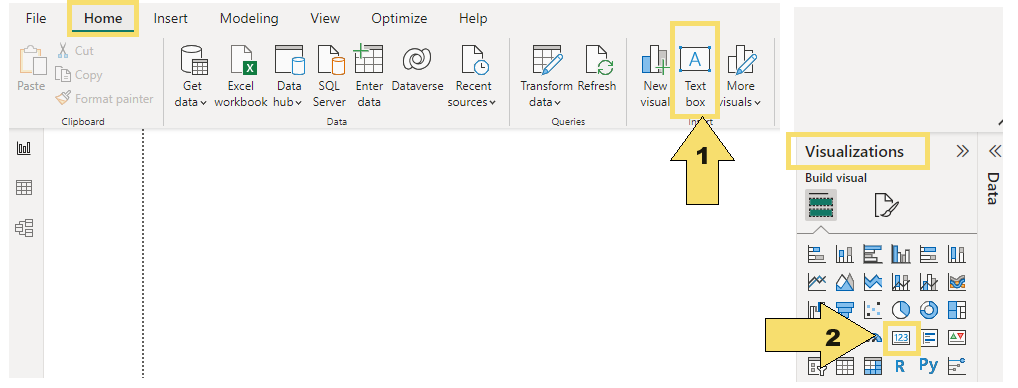
First it will be created high-level Dashboard objects - the title and two data cards containing survey taker count and their average age. Title will be created as Text Box (1) within Home menu item, and Data card will be created using Card button (2) within Visualizations tab
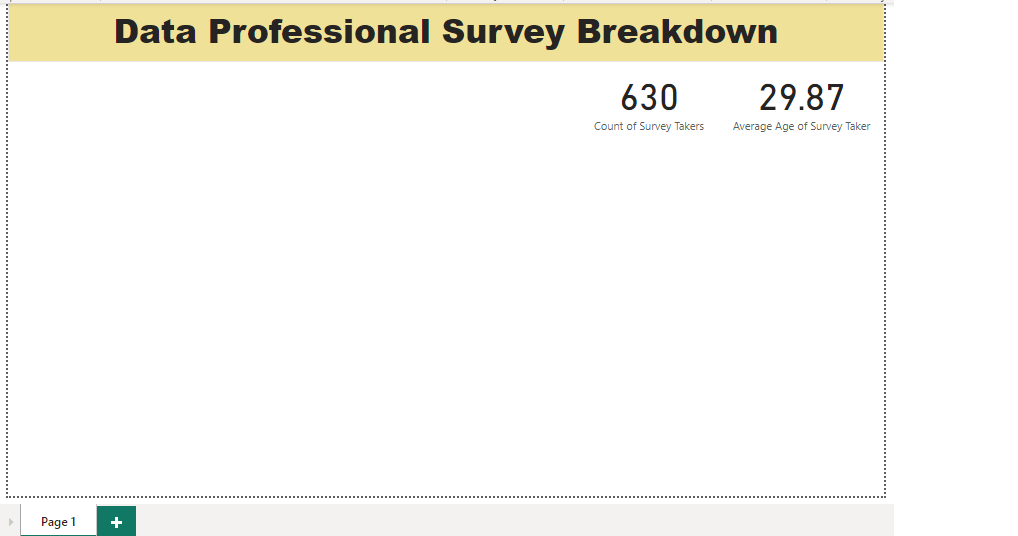
After creating, connecting with data fields and formatting, there is an initial Dashboard containig only high-level objects that will be visible at first sight:
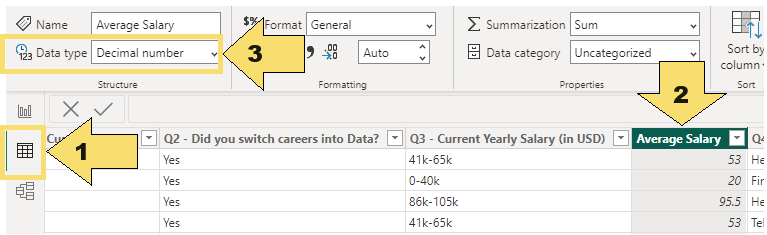
Visualization of average salary will be created using stacked bar chart. First it will be changed data type of the Average column by switching to Data view (1), selecting column (2) and choosing Decimal number data type for it (3):
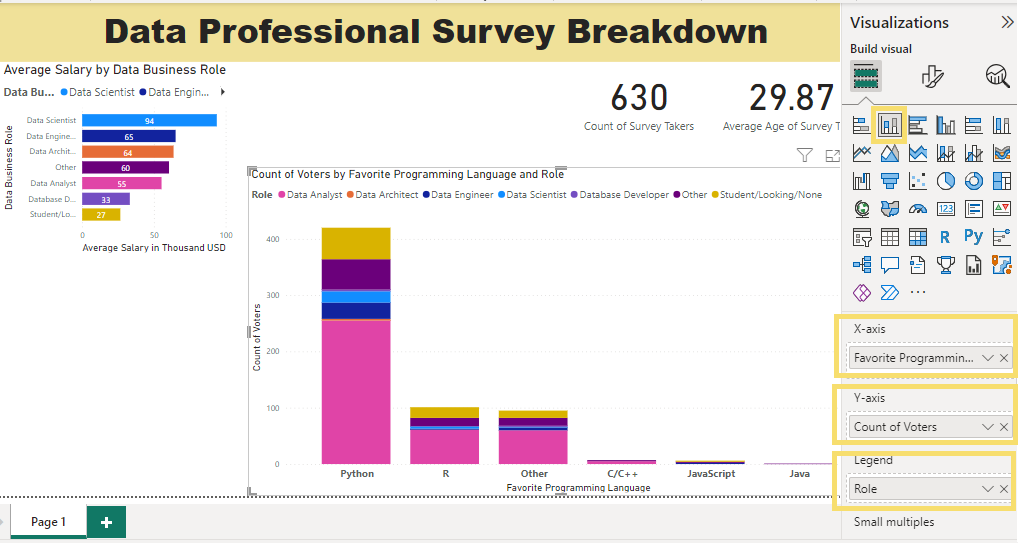
Average salary stacked bar chart is built and formatted by adding data fields to X-axis, Y-axis and Legend boxes within Visualizations panel
2-Top 5 programming languages used by Data Professionals
Favorite programming language is visualized using stacked column chart, connecting visual wit data fields and formatting:
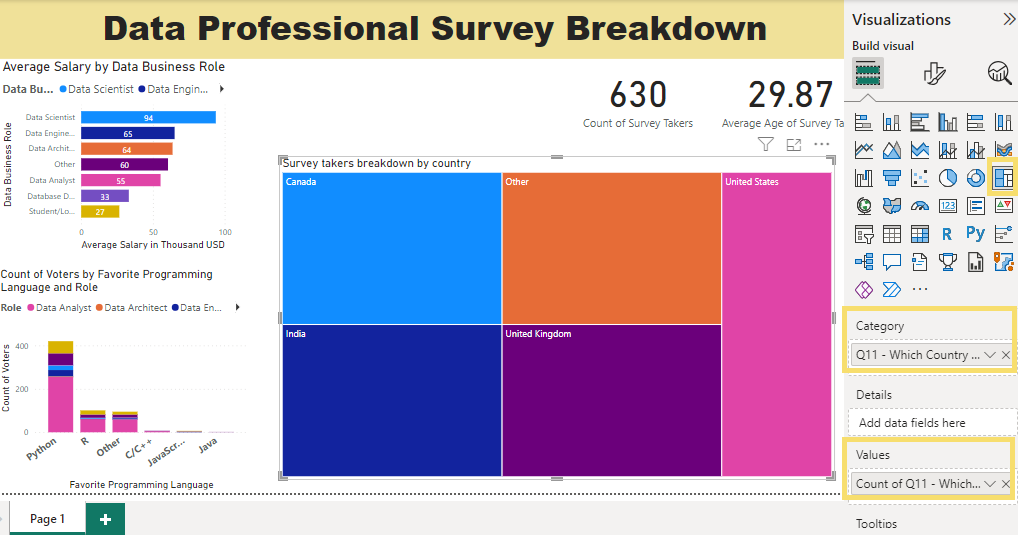
3-Survey taker count and top countries they come from
Breakdown by coutry will be visualized using TreeMap. Both in Category section and in Values section the visual is connected to the field Q11-Which country do you live in, and in Values section the values are shown as Count (Distinct)
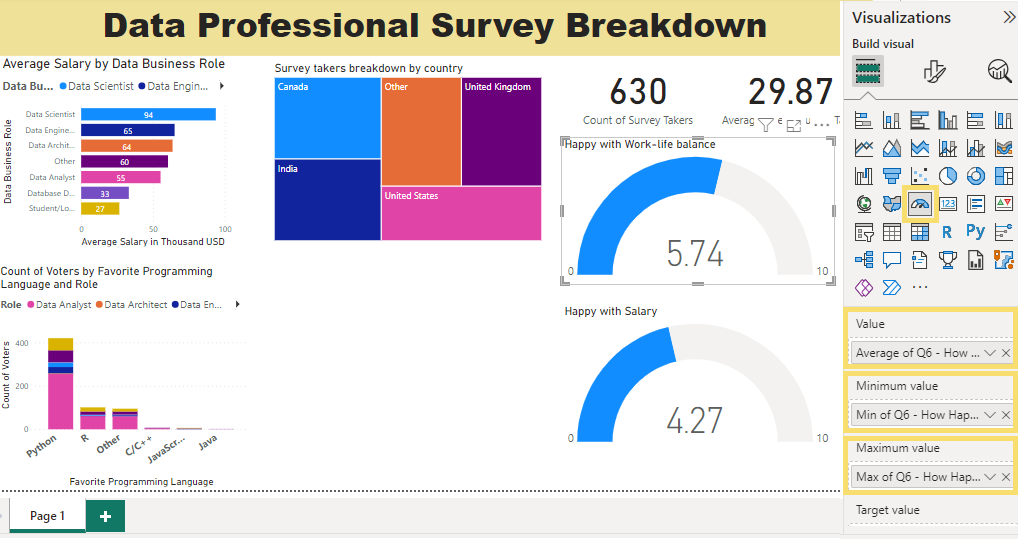
4-Rating of hapiness with salary and work-life balace
The average rating of happines with these particular role aspects are visualize using Gauge chart. Connection to particular data field is established as Average in Value field, and Minimum/Maximum in Minimum value/Maximum value fields as well:
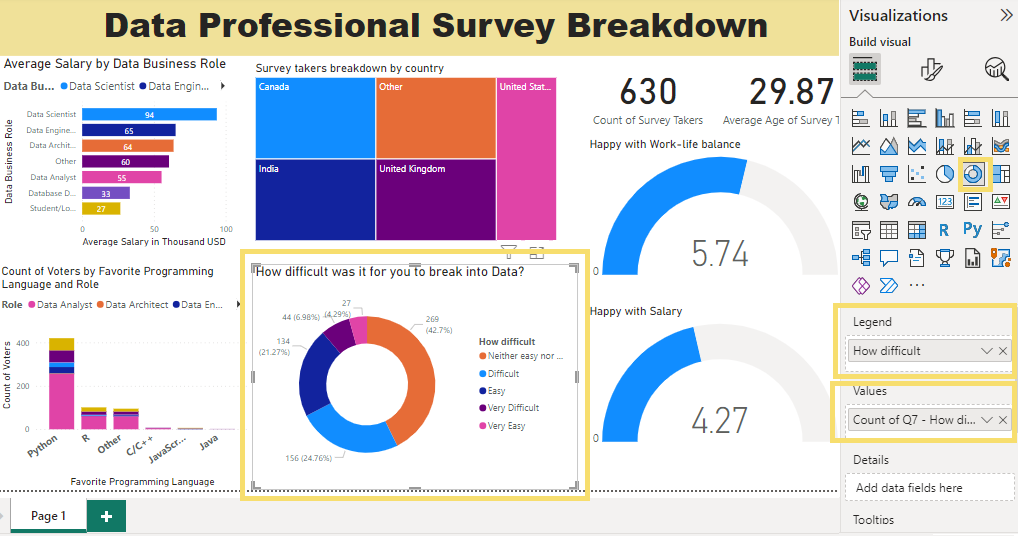
5-Difficulty of break into data
This is visualized using Donut chart, connecting with Data field both Legend and Values section, and applying Count aggregation in the Values section
Since the created Dashboard is interactive, in particular for USA after selecting it in Tree View map, all visualizations show selected data subset:
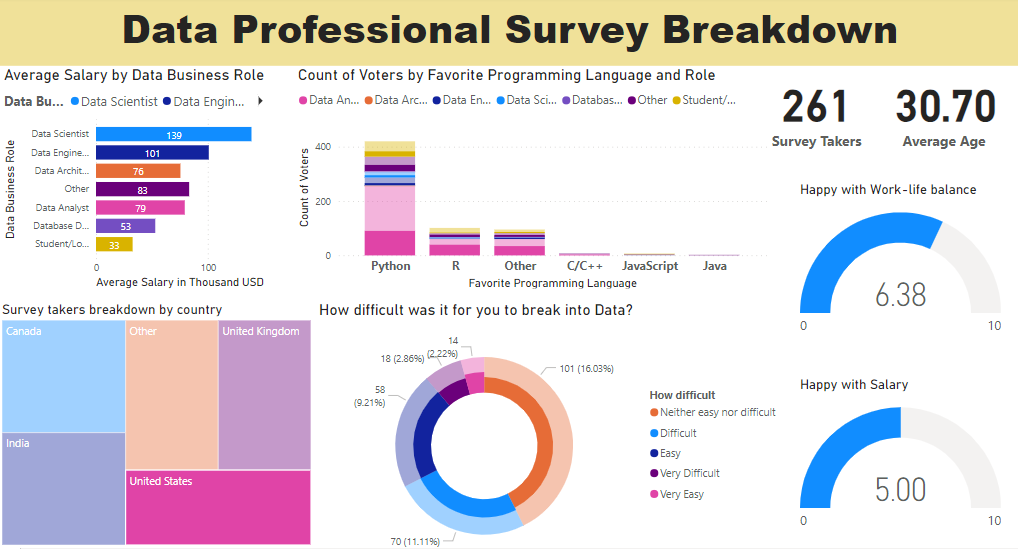
The Final version of the Dashboard shows overall data insights in each visualization: