


RESUME - Project overview
Jump to: SOLUTION -Project implementation
Skills & Concepts demonstrated
A multi-national firm has hired me as a data engineer. My job is to access and process data as per requirements. Using Python skills for ETL there will be extracted, transformed and loaded real-world data about the world's largest banks into a database for further processing and querying.
Problem Statement
My boss asked me to compile the list of the top 10 largest banks in the world ranked by market capitalization in billion USD.
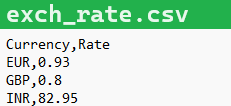
Further, I need to transform the data and store it in USD, GBP, EUR, and INR per the exchange rate information made available to me as a CSV file. I should save the processed information table locally in a CSV format and as a database table.
Managers from different countries will query the database table to extract the list and note the market capitalization value in their own currency.
Skills & Concepts demonstrated
This project demonstrates how to perform ETL operations on real-world data and make the processed information available for further use in different formats. Following skills are shown:
There are following tasks to be accomplished:
Tasks & Questions
1. Write a function log_progress() to log the progress of the code at different stages in a file code_log.txt. Use the list of log points provided to create log entries as every stage of the code.
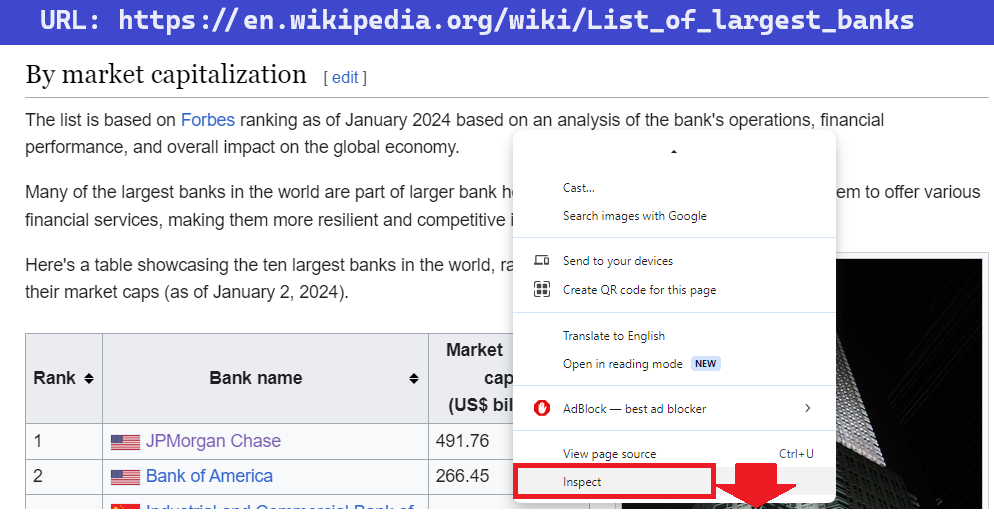
2. Extract the tabular information from the given URL under the heading 'By market capitalization' and save it to a dataframe.
3. Transform the dataframe by adding columns for Market Capitalization in GBP, EUR and INR, rounded to 2 decimal places, based on the exchange rate information shared as a CSV file.
4. Load the transformed dataframe to an output CSV file. Write a function load_to_csv(), execute a function call and verify the output.
5. Load the transformed dataframe to an SQL database server as a table. Write a function load_to_db(), execute a function call and verify the output.
6. Run queries on the database table. Write a function load_queries(), execute a given set of queries and verify the output.
7. Verify that the log entries have been completed at all stages by checking the contents of the file code_log.txt.
Insights
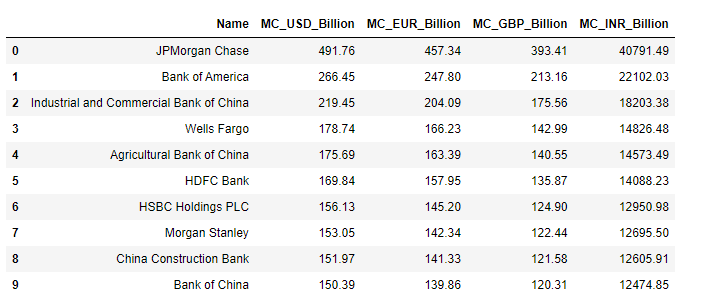
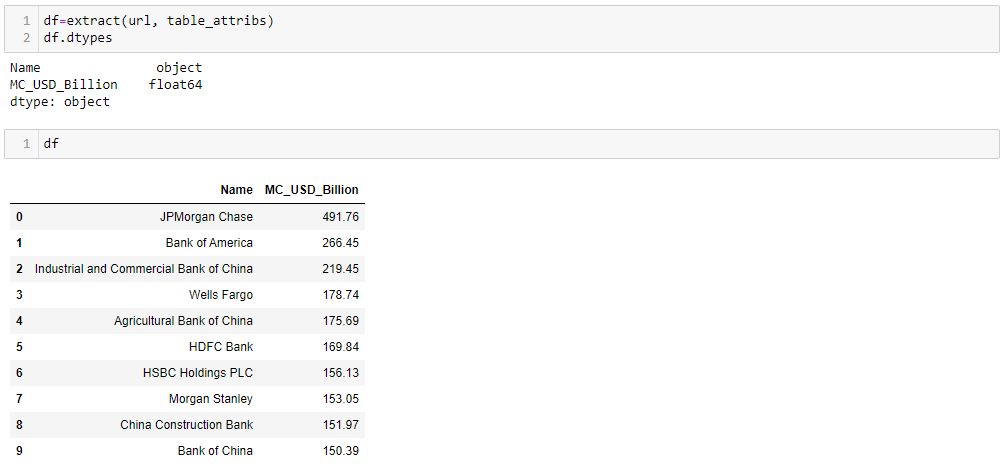
1. Full list of 10 world's largest banks in USD
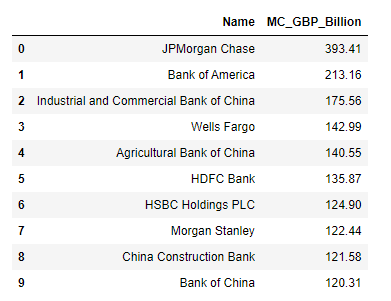
2. London office - Top 10 banks list in GBP
3. Berlin office - Average MC of all the banks in EUR
Average MC is 196.55 Billion EUR, calculated for top 10 world's largest banks
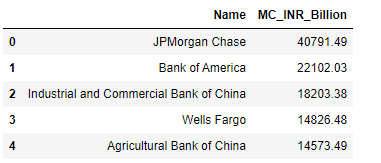
4. New Delhi office - Top 5 banks in INR
5. Log file content
SOLUTION - Project implementation
Back to: RESUME -Project overview
0.2-Importing modules and packages
0.3-Initialization of known entities
2-Extracting data using Webscraping and saving it to dataframe
7-Invoking ETL functions & Checking log file content
From the
GitHub repository
it can be downloaded
Before building the code, it's neccessary to install the required libraries.
0.1-Installing libraries
The libraries needed for the code are:
!pip install requests
!pip install bs4
!pip install pandas
!pip install sqlite3
!pip install numpy
!pip install datetime
0.2-Importing modules and packages
After installing libraries modules and packages are imported:
import pandas as pd
import requests
from bs4 import BeautifulSoup
import sqlite3
from datetime import datetime
0.3-Initialization of known entities
Data URL is Wikipedia page from which data will be extracted using Webscraping, and it's path is initialized as a variable url. There are also initialized Database name, Table name, Table Attributes (upon Extraction only), Exchange rate CSV path, Output CSV Path and Log file name.
url = 'https://en.wikipedia.org/wiki/List_of_largest_banks'
db_name = 'Banks.db'
table_name = 'Largest_banks'
table_attribs = ["Name", "MC_USD_Billion"]
csv_path_exchange = 'https://github.com/berislav-vidakovic/Portfolio/blob/main/PythonETL/exchange_rate.csv'
csv_path_load = 'Largest_banks_data.csv'
log_file = 'code_log.txt'
1-Log function
This function logs the progress of the code, it accepts the message to be logged and enters it to a text file code_log.txt.
The format to be used for logging has the following syntax - time_stamp : message.
Each log entry happens in the next line in the text file. The log entries are associated with each of the executed function calls.
| Task | Log message on completion |
|---|---|
| Declaring known values | Preliminaries complete. Initiating ETL process |
| Call extract() function | Data extraction complete. Initiating Transformation process |
| Call transform() function | Data transformation complete. Initiating Loading process |
| Call load_to_csv() | Data saved to CSV file |
| Initiate SQLite3 connection | SQL Connection initiated |
| Call load_to_db() | Data loaded to Database as a table, Executing queries |
| Call run_query() | Process Complete |
| Close SQLite3 connection | Server Connection closed |
The table above shows the logging message at the end of each function call that follows.
Implementation of the log function follows below.
#LOGGING DATA ----------------------------------------------------------
def log_progress(message):
    ''' This function logs the mentioned message of a given stage of the
    code execution to a log file. Function returns nothing'''
    timestamp_format = '%Y-%h-%d-%H:%M:%S' # Year-Monthname-Day-Hour-Minute-Second
    now = datetime.now() # get current timestamp
    timestamp = now.strftime(timestamp_format)
    with open(log_file,"a") as f:
        f.write(timestamp + ' : ' + message + '\n')
2-Extracting data using Webscraping and saving it to dataframe
Data will be analyzed from the webpage on the given URL:
https://web.archive.org/web/20230908091635/https://en.wikipedia.org/wiki/List_of_largest_banks.
The position of the required table is identified as the table under the heading "By market capitalization".
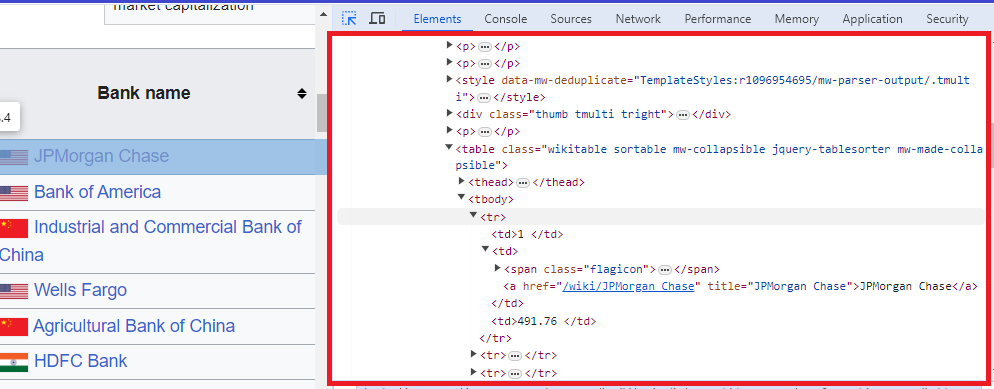
The function extract() retrieves the information of the table to a Pandas data frame.
def extract(url, table_attribs):
    ''' This function aims to extract the required information from the website and save it to a data frame.
    The function returns the data frame for further processing. '''

    df = pd.DataFrame(columns=table_attribs)
    # load the entire web page as an HTML document in python
    html_page = requests.get(url).text
    # parse the text  to enable extraction of relevant information.
    data = BeautifulSoup(html_page, 'html.parser')
    # extract the rows of the table needed
    tables = data.find_all('tbody')
    rows = tables[0].find_all('tr') #
    # iterate over the rows, col->dict->df
    for row in rows:
        col=row.find_all('td')
        table_data_row=[item.text.strip() for item in col]
        if len(table_data_row) > 2:
            data_dict = { table_attribs[0]: table_data_row[1],
                          table_attribs[1]: table_data_row[2], }
            df1 = pd.DataFrame(data_dict, index=[0])
            df = pd.concat([df,df1], ignore_index=True)

    df['MC_USD_Billion'] = df['MC_USD_Billion'].astype('float')
    return df
Values are typecasted to float format. The relevant log entry is made
3-Transformation of data
The Transform function needs to perform the following tasks:
def transform(df, csv_path):
    ''' This function accesses the CSV file for exchange rate information, and adds three columns to the data frame,
    each containing the transformed version of Market Cap column to respective currencies'''

    dfExchange = pd.read_csv(csv_path)
    dfExchange.set_index('Currency', inplace=True)

    eur = dfExchange.at['EUR', 'Rate']
    gbp = dfExchange.at['GBP', 'Rate']
    inr = dfExchange.at['INR', 'Rate']

    df['MC_EUR_Billion'] = round(df['MC_USD_Billion'] * eur, 2)
    df['MC_GBP_Billion'] = round(df['MC_USD_Billion'] * gbp, 2)
    df['MC_INR_Billion'] = round(df['MC_USD_Billion'] * inr, 2)

    log_progress('Data transformation complete. Initiating Loading process')
The resulting dataframe contains 3 more columns
4-Loading to CSV
The function load_to_csv() loads the transformed data frame to a CSV file, in the path initialized previously. The relevant log entry is made
def load_to_csv(df, csv_path):
    ''' This function saves the final data frame as a CSV file in
    the provided path. Function returns nothing. '''
    df.to_csv(csv_path, index=False)
    log_progress('Data saved to CSV file')
5-Loading to Database
The function load_to_db() loads the transformed data frame to an SQL database, passing the database and table names as initialized previously, using DataFrame.to_sql() function. Before calling this function, it will be initiated the connection to the SQLite3 database server with the name Banks.db. This connection object is passed, along with the required table name Largest_banks and the transformed data frame, to the load_to_db() function in the function call. The relevant log entry is made.
Upon successful function call, there will be loaded the contents of the table with the required data.
def load_to_db(df, sql_connection, table_name):
    ''' This function saves the final data frame to a database
    table with the provided name. Function returns nothing.'''
    df.to_sql(table_name, sql_connection, if_exists = 'replace', index =False)
    log_progress("Data loaded to Database as a table, Executing queries")
6-Running queries
The function run_queries() accepts the query statement, and the SQLite3 Connection object, and generates the output of the query by using pandas.read_sql() function. The query statement should be printed along with the query output
def run_queries(sql_connection, query_statement):
''' This function runs the passed query and adds query statement
and query results to the log file. Function returns nothing.'''
query_output = pd.read_sql(query_statement, sql_connection)
log_progress(f"Running query... {query_statement}")
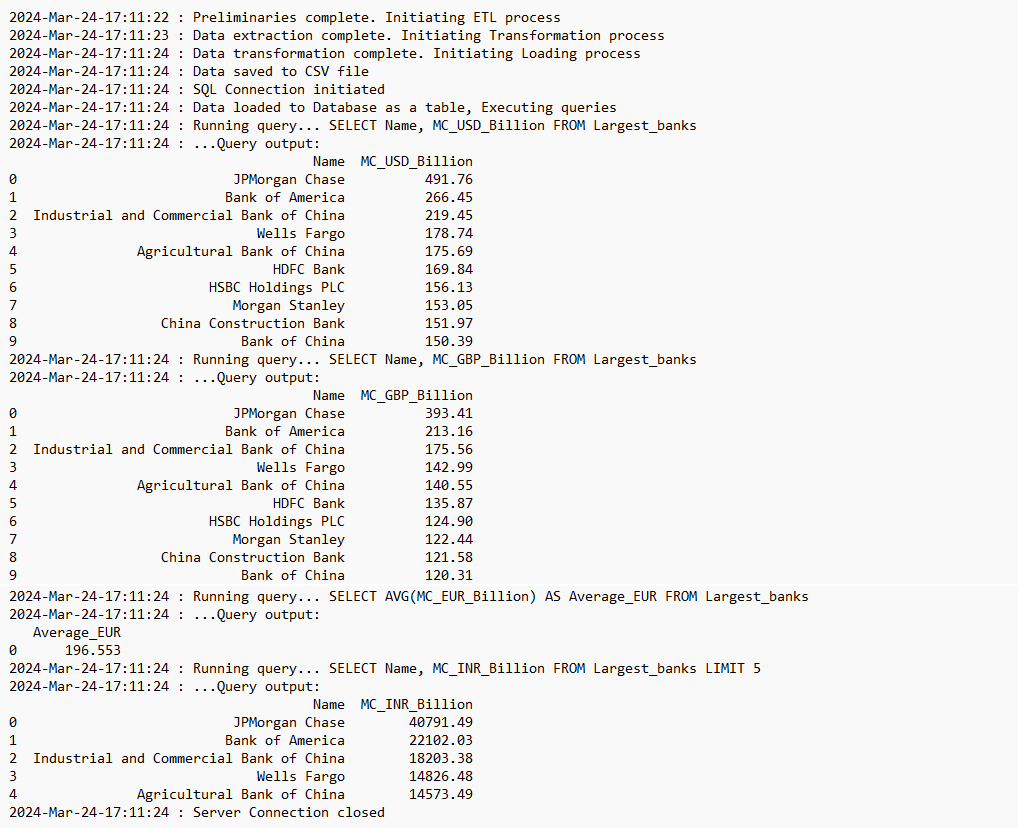
log_progress(f"...Query output:\n{query_output}")7-Invoking ETL functions & checking log file
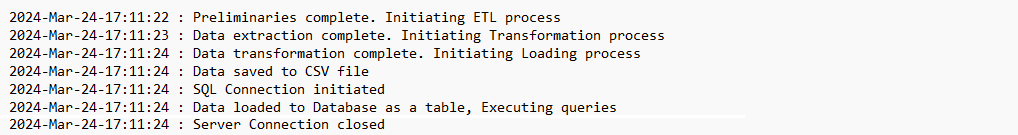
Upon successful completion of execution, the code_log.txt file should contain all relevant entries as proof that ETL process ran as expected.
log_progress("Preliminaries complete. Initiating ETL process")

# EXTRACT DATA
df=extract(url, table_attribs)

# TRANSFORM DATA
#Adding "?raw=true" at the end of the GitHub URL to get the raw file link
transform(df, csv_path_exchange+"?raw=true")

#LOAD DATA
load_to_csv(df,csv_path_load)

# create and connect  process to a  database Banks.db
conn = sqlite3.connect(db_name)
log_progress("SQL Connection initiated")

load_to_db(df, conn, table_name)

run_queries(conn, "SELECT Name, MC_USD_Billion FROM Largest_banks")
run_queries(conn, "SELECT Name, MC_GBP_Billion FROM Largest_banks")
run_queries(conn, "SELECT AVG(MC_EUR_Billion) AS Average_EUR FROM Largest_banks")
run_queries(conn, "SELECT Name, MC_INR_Billion FROM Largest_banks LIMIT 5")

# close DB connection
conn.close()
log_progress("Server Connection closed")
Finally, there should be all the relevant entries made in the text file in relation to the stages of code execution.