
RESUME - Project overview
Jump to: SOLUTION -Project implementation
Skills & Concepts demonstrated
SuperStore, a very large supermarket selling household goods and equipment, made their Dataset containing Sales & Profits details over few years available on The kaggle website The main competitor ordered Data Analysis of published data for the purpose of benchmarking. Insights should provide a basis for strategical decisions regarding market positioning, creating matching marketing mix and market segmenting.
Problem Statement
There is dataset in CSV file that contains SuperStore's sales data over a 4-year period. Customer requires data modelling in a database and finding insights to answer some business questions.
Skills & Concepts demonstrated
There are following MS SQL Server features used in this project
Customer wants to answer the following questions:
Questions
1. Get overall data insights, how many are there: Total orders/period, Sales teams/managers, Delivery Cities/different postal codes, Customers/customer segments, Products/product categories/subcategories
2. Categorize customers to Silver (spent less than 5,000), Gold (spent 5,000-15,000) and Platinum (spent more than 15,000). Count customers by category and get average and total spent by category
3. For each manager get total sales per year. As per strategical planning from the year 2014, each manager had target growth of total sales of 50% during the period 2014-2017. Which managers met this target requirement?
4. Get running totals per year for each product category. The assortiment is planned to be extended in order to increase the turnover. Main guideline for this decision will be the product category that had the highest percentage profit increase during the 4-year period. What will be the category of new products added?
5. For the purpose of reducing transport cost, there should be hired one more transport company for the top 3-5 delivery destinations, depending on offers received and the budget available. Which are top 5 cities with the highest delivery volume overall, and top 3 cities yearwise?
Insights
1. Overall data exploration results show there are:
2. There are most customers in the Gold category (331), on the 2nd place are the customers in the Platinum category (255) and the lowest customer count is in the Silver category (207). As expected, Platinum customers spent the most in total (7,829,092) and in average (30,702), followed by Gold customers in total (3,125,192) and in average (9,442), and by Silver customers in total (520,803) and in average(2,516).


3. Out of 5 managers, there are 3 of them who met the target requirement: the most successful manager is Britanny Bold that achieved increase of 147% (from 157,001 to 389,355), followed by James Goodwill achieving increase of 97% (from 153,266 to 303,076) and Tracy Banks who achieved increase of 58% (from 245,166 to 388,823)
4. The highest running profit increase (576%) is in Technology category (from 21,493 to 145,387), followed by Office supplies (440%) category (from 22,593 to 122,133) and Furniture (234%) category (from 5,470 to 18,297).


5. Top delivery destinations overall is New York City with the most (914) deliveries, followed by Los Angeles (747), Philadelphia (537), San Francisco (510) and Seattle (428).


SOLUTION - Project implementation
Back to: RESUME -Project overview
0.1-Creating database & Orders table
0.2-Populating Table from CSV file
0.5-Entity Relationship Diagram
2-Customer categorization by order volume
3-Managers' total sales per year
4-Running total of profit year wise for each product category
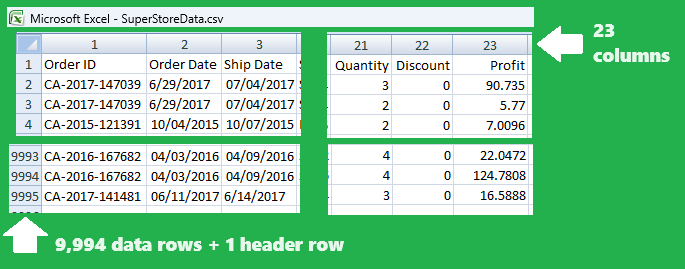
The raw data source is CSV file containing denormalized data.
From the
GitHub repository
it can be downloaded
Before processing business questions, there is database to be created, populated and cleaned from duplicates/NULL values. The next step is data normalization and referential integrity ensurance by creating primary and foreign keys.
0.1-Creating Database and Orders table
As the first step it is to be created the database with one main empty table that has a structure that matches the source CSV file:
--Creating database & Orders table
DROP DATABASE IF EXISTS dbSuperStore
CREATE DATABASE dbSuperStore

--Creating an empty table as per CSV structure
USE dbSuperStore
DROP TABLE IF EXISTS tblOrders

CREATE TABLE tblOrders(
  Order_ID CHAR(14), Order_Date DATE, Ship_Date DATE, Ship_Mode VARCHAR(20), Customer_ID CHAR(8), Customer_Name VARCHAR(30),
  Segment VARCHAR(30), Sales_Rep VARCHAR(30), Sales_Team VARCHAR(30), Sales_Team_Manager VARCHAR(30), Location_ID VARCHAR(35),
  City VARCHAR(25), [State] VARCHAR(25), Postal_Code CHAR(16), Region VARCHAR(20), Product_ID CHAR(15), Category VARCHAR(25),
  Sub_Category VARCHAR(25), Product_Name VARCHAR(200), Sales NUMERIC(10, 2), Quantity INT, Discount DECIMAL(10,2), Profit DECIMAL(10, 2)
)
The following inline table-valued function obtains table structure and returns column ID and column name as a table, so it will be used to check the structure of the table created:
--Returns table with 2 columns: (ID, ColumnName) of passed table, from the system view in the master DB
CREATE OR ALTER FUNCTION fnColumnNames(@tableName varchar(50))
RETURNS TABLE
AS
RETURN
(
  SELECT column_id AS ID, name AS ColumnName
  FROM sys.columns AS vwTableColumns
  WHERE vwTableColumns.[object_id] = OBJECT_ID(@tableName )
)

SELECT * FROM fnColumnNames('tblOrders')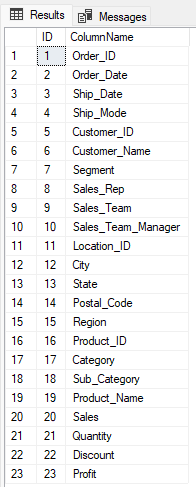
0.2-Populating Table from CSV file
The raw file is downloaded and table is populated, defining the 1st row as a header:
--Populate table with data from CSV file
BULK INSERT tblOrders
FROM "C:\Users\User\OneDrive\Documents\BLOG\Portfolio\SuperStoreData.csv"
WITH (firstrow = 2, fieldterminator = ',' );
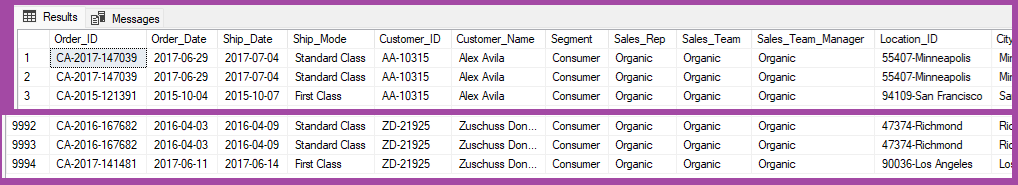
SELECT * FROM tblOrders
0.3-Data Cleaning
It is neccessary to do the Data Cleaning, in order to enable data quality and to be able to provide more accurate, consistent and reliable information for decision-making. Within data cleaning there will be checked NULL values as well as duplicates.
Check for NULL values
One way for NULL values detecting is to select records that contain any NULL values, which can be accomplished using dynamic SQL as follows.
--Creating stored procedure that selects records with NULL values
CREATE OR ALTER PROCEDURE spSelectNullRecords @tblName AS varchar(50)
AS
BEGIN
	DECLARE @CursorID int = 1
	DECLARE @sqlSelect nvarchar(1000)
	DECLARE @ColumnCnt int = 0
	DECLARE @Column nvarchar(25)

	SET @sqlSelect = 'SELECT * FROM ' + @tblName + '  WHERE '
	SELECT @ColumnCnt = COUNT(*) FROM fnColumnNames(@tblName)

	SELECT TOP 1 @Column =  ColumnName FROM fnColumnNames(@tblName)
	SET @sqlSelect = @sqlSelect + @Column + ' IS NULL ';

	WHILE @CursorID < @ColumnCnt
		BEGIN
			SET @CursorID = @CursorID + 1
			SELECT @Column =  ColumnName FROM fnColumnNames(@tblName) WHERE ID=@CursorID
			SET @sqlSelect = @sqlSelect + ' OR ' + @Column + ' IS NULL '
		END
	EXEC sp_executesql @sqlSelect
END

EXEC spSelectNullRecords 'tblOrders' 
There are 2 records that contain NULL values and it will be easy to remove them. However, we don't see immediately every column that contains NULL value, in case we need this information we should scroll little to the right. So if there are large number of rows and/or columns, these results may not be very useful i.e. it may be difficult to detect each and every column that contains NULL value. The more efficient way would be to create a table that shows NULL value count for each column.
The following stored procedure builds and executes dynamic SQL statement that inserts row into global temporay table (GTT), containing 2 columns: column name and NULL value count. NULL values are counted as a difference between COUNT(*) - that includes NULL values - and COUNT(Column) - that excludes NULL values. If the GTT still doesn't exist - i.e. the first record is to be inserted into a new table - the SELECT INTO statement is built, otherwise it is built INSERT INTO SELECT statement. The two cases are distinguished with the first record flag.
--Count and store NULL values per column in 2 columns (ColumnName, NULLs) of a GTT
CREATE OR ALTER PROCEDURE spStoreNULLCount @tblName AS nvarchar(50), @colName AS nchar(25), @tmpTable AS varchar(20), @bFirstRec AS bit=0
AS
BEGIN
  DECLARE @sqlSelect nvarchar(1000)

  IF @bFirstRec = 1
    SET @sqlSelect = 'SELECT ''' + @colName +''' AS ColumnName, COUNT(*)-COUNT(' + @colName + ') AS NULLs
              INTO ' + @tmpTable + ' FROM ' + @tblName
  ELSE
    SET @sqlSelect = 'INSERT INTO '+ @tmpTable +
              ' SELECT ''' + @colName + ''', COUNT(*)-COUNT(' + @colName + ') FROM ' + @tblName
  PRINT 'Executing... ' + @sqlSelect
  EXEC sp_executesql @sqlSelect
END
For each column the a.m. procedure will be called, passing first record flag for the first column. The procedure below at the end selects records from GTT where there are 1 or more NULL values and drops the table afterwards.
----Creating stored procedure that shows NULL value count for each column as (ColumName, NULLs)
CREATE OR ALTER PROCEDURE spShowNullValues @tblName AS varchar(50)
AS
BEGIN
  DECLARE @CursorID int = 1
  DECLARE @ColumnCnt int = 0
  DECLARE @Column nchar(25)

  SELECT @ColumnCnt = COUNT(0) FROM fnColumnNames(@tblName)
  IF(@ColumnCnt = 0)
  BEGIN
    PRINT 'No columns found in the passed table!'
    RETURN
  END

  --The 1st record
  SELECT TOP 1 @Column =  ColumnName FROM fnColumnNames(@tblName)
  DROP TABLE IF EXISTS ##tempTbl
  EXEC spStoreNULLCount @tblName, @Column, '##tempTbl', 1

  WHILE @CursorID < @ColumnCnt
    BEGIN
      SET @CursorID = @CursorID + 1
      SELECT @Column =  ColumnName
        FROM fnColumnNames(@tblName)
        WHERE ID=@CursorID
      EXEC spStoreNULLCount @tblName, @Column, '##tempTbl'
    END

  SELECT * FROM ##tempTbl WHERE NULLs > 0
  DROP TABLE ##tempTbl
END

EXEC spShowNullValues 'tblOrders'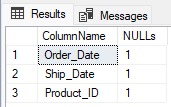
Now it's clear which columns should be included in deletion of records containing any NULL value
DELETE FROM tblOrders WHERE Order_Date IS NULL OR Ship_Date IS NULL OR Product_ID IS NULL
EXEC spShowNullValues 'tblOrders'
SELECT * FROM tblOrders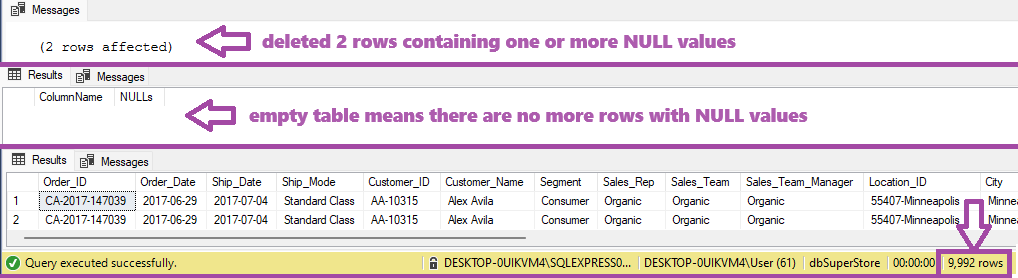
Check for duplicates
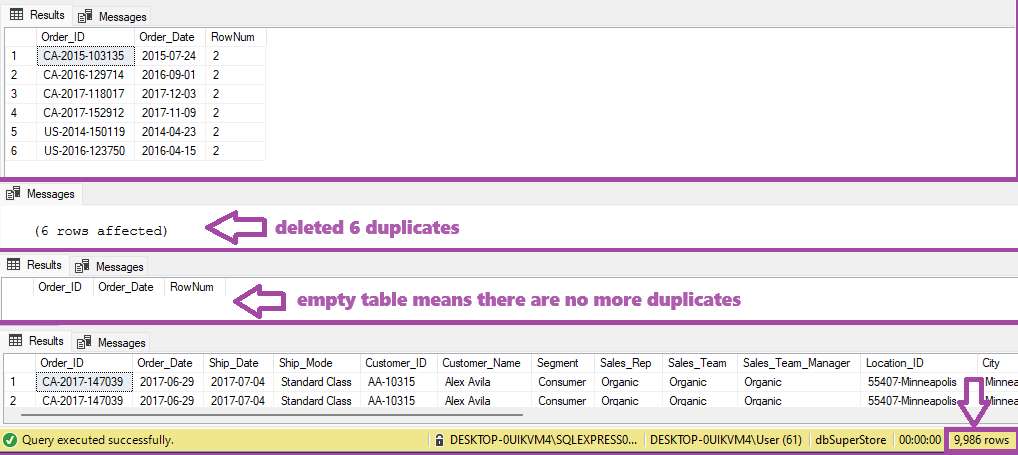
Using Window function ROW_NUMBER() duplicates are marked as per criteria defined in the Problem Statement section: each order is uniquely defined by ID of the order and product and by date of the order and shipping. That means the columns Order_ID, Order_Date, Ship_Date and Product_ID will be used in PARTITION BY clause. Within the new column containing row number with value higher than 1 there are duplicates marked, and will be deleted from underlying table of the created view. There are 6 duplicate records in total that are deleted:
--Check for duplicates and delete duplicate records
CREATE OR ALTER VIEW vwMarkDuplicates
AS
SELECT Order_ID, Order_Date,
    ROW_NUMBER() OVER(PARTITION BY Order_ID, Order_Date, Ship_Date, Product_ID ORDER BY Order_ID) RowNum
FROM tblOrders

SELECT * FROM vwMarkDuplicates
WHERE RowNum > 1 --show duplicates

DELETE FROM vwMarkDuplicates
WHERE RowNum > 1 --delete duplicates

SELECT * FROM vwMarkDuplicates
WHERE RowNum > 1 --double check duplicates after deletion

SELECT * FROM tblOrders
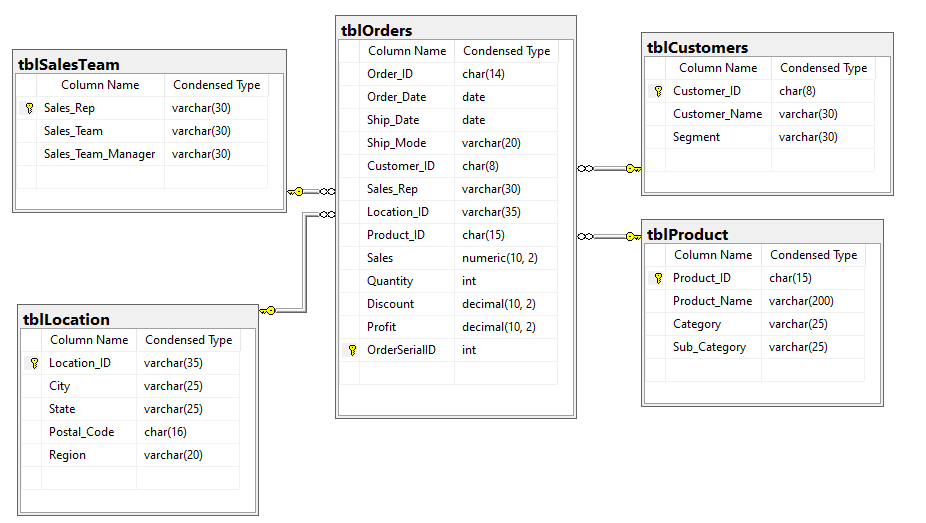
0.4-Database Normalization
In the database normalization process there will be created separate tables for the following entities: Customers, Product, SalesTeam and Location, which will reduce redundancy. There are scripts that perform DB normalization:
--Data normalization
--Creating Customers table
DROP TABLE IF EXISTS tblCustomers
SELECT DISTINCT Customer_ID, Customer_Name, Segment
INTO tblCustomers FROM tblOrders

--Creating Product table
DROP TABLE IF EXISTS tblProduct
SELECT DISTINCT Product_ID, Product_Name, Category, Sub_Category
INTO tblProduct FROM tblOrders

--Creating SalesTeam table
DROP TABLE IF EXISTS tblSalesTeam
SELECT DISTINCT Sales_Rep, Sales_Team, Sales_Team_Manager
INTO tblSalesTeam FROM tblOrders

--Creating Location table
DROP TABLE IF EXISTS tblLocation
SELECT DISTINCT Location_ID, City, [State], Postal_Code, Region
INTO tblLocation FROM tblOrders

--Drop columns that became redundant from main table tblOrders
ALTER TABLE tblOrders
DROP COLUMN Customer_Name, Segment, Sales_Team, Sales_Team_Manager,
        City, [State], Postal_Code, Region, Category, Sub_Category, Product_Name
After splitting the main table to new tables, there will be established relationship between tables by creating the primary keys and foreign keys:
--Table alteration
--Adding primary keys
ALTER TABLE tblCustomers ALTER COLUMN Customer_ID char(8) NOT NULL
ALTER TABLE tblCustomers ADD CONSTRAINT PK_CustID PRIMARY KEY (Customer_ID)

ALTER TABLE tblLocation ALTER COLUMN Location_ID varchar(35) NOT NULL
ALTER TABLE tblLocation ADD CONSTRAINT PK_LocID PRIMARY KEY (Location_ID)

ALTER TABLE tblProduct ALTER COLUMN Product_ID char(15) NOT NULL
ALTER TABLE tblProduct ADD CONSTRAINT PK_ProdID PRIMARY KEY (Product_ID)

ALTER TABLE tblSalesTeam ALTER COLUMN Sales_Rep varchar(30) NOT NULL
ALTER TABLE tblSalesTeam ADD CONSTRAINT PK_SalesRep PRIMARY KEY (Sales_Rep)

--Adding PK to Orders table and setting Foreign keys
ALTER TABLE tblOrders ADD OrderSerialID int IDENTITY PRIMARY KEY

ALTER TABLE tblOrders ADD CONSTRAINT FK_Customer_ID
FOREIGN KEY (Customer_ID) REFERENCES tblCustomers (Customer_ID)

ALTER TABLE tblOrders ADD CONSTRAINT FK_Product_ID
FOREIGN KEY (Product_ID) REFERENCES tblProduct (Product_ID)

ALTER TABLE tblOrders ADD CONSTRAINT FK_Location_ID
FOREIGN KEY (Location_ID) REFERENCES tblLocation (Location_ID)

ALTER TABLE tblOrders ADD CONSTRAINT FK_Sales_Rep
FOREIGN KEY (Sales_Rep) REFERENCES tblSalesTeam (Sales_Rep)
0.5-Entity Relationship Diagram
After creating relations with primary keys and foreign keys, this database is in the 2nd normal form. It could be further normalized to the 3rd normal form, since there are still partial transitive dependencies (such as State and Postal_Code dependency on City attribute in tblLocation, as well as some in other tables too). For this project this will be good enough for the reason of enabling simpler queries, reducing data complexity and improving transparency.
1-Overall data insights
Getting relevant information about data for each entity with the following script gave the b.m. results:
--1-Overall data insights
SELECT COUNT(*) AS Orders FROM tblOrders
SELECT DISTINCT(YEAR(Order_Date)) AS OrderYear FROM tblOrders

SELECT COUNT(*) AS Teams FROM tblSalesTeam
SELECT DISTINCT(Sales_Team_Manager) AS Managers FROM tblSalesTeam

SELECT COUNT(*) As Locations FROM tblLocation
SELECT COUNT(DISTINCT City) As Cities FROM tblLocation

SELECT COUNT(*) As Customers FROM tblCustomers
SELECT DISTINCT Segment FROM tblCustomers

SELECT COUNT(*) AS Products FROM tblProduct
SELECT DISTINCT Category FROM tblProduct
SELECT COUNT(DISTINCT Sub_Category) AS SubCategories FROM tblProduct 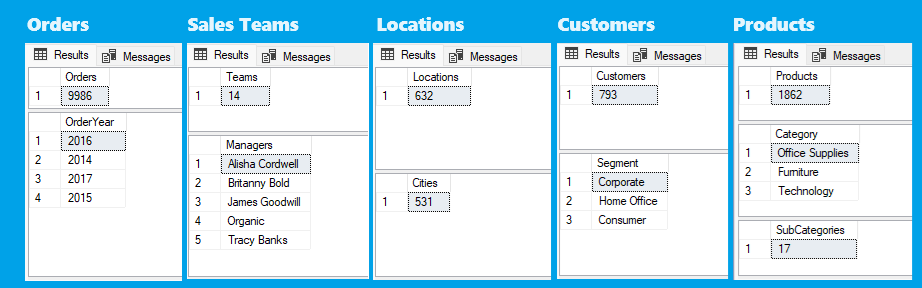
2-Customer categorization by order volume
Caustomer categorization as per customer's request is implemented using CTE and SELECT..CASE statement, as shown in the script below, getting results shown below the script:
--2-Categorize customers:
--0-5,000 Silver, 5,000-15,000 Gold, >15,000 Platinum
--Using CTE to create column of Total amount spent by customer
CREATE OR ALTER VIEW vwCustCategories AS
WITH CTE_Spent(Cust, Spent)
AS(
  SELECT c.Customer_Name, SUM(o.Sales*o.Quantity)
  FROM tblOrders AS o
  LEFT JOIN tblCustomers AS c
  ON o.Customer_ID=c.Customer_ID
  GROUP BY c.Customer_Name
) --in CASE statement implemented business logic for customer categorization
SELECT
  Cust,
  Spent,
  CASE
    WHEN Spent > 15000 THEN 'Platinum'
    WHEN Spent < 5000  THEN 'Silver'
    ELSE 'Gold'
  END AS CustCategory
FROM CTE_Spent

SELECT * FROM vwCustCategories --all 793 customers has assigned category

--Get count, average and total spent by category
CREATE OR ALTER VIEW vwCategoryDetails AS
SELECT
  CustCategory, SUM(Spent) AS TotalSpent, AVG(Spent) AS AvgSpent, COUNT(Spent) AS CustCount
FROM vwCustCategories
GROUP BY CustCategory

--Format results with thousand separator
SELECT
  CustCategory AS Category,
  FORMAT(TotalSpent, '#,0') AS SpentTotal,
  FORMAT(AvgSpent, '#,0') AS SpentAvg,
  CustCount AS Customers
FROM vwCategoryDetails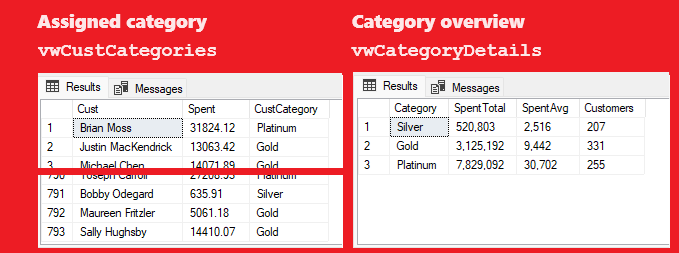
3-Managers' total sales per year
This question was answered using Pivot table, Join and aggregate functions. To prepare data source for pivot table it is created a view that shows total sales breakdown by manager and by year, in total 20 rows. Final results are shown in ivot table with manager in rows and year in columns. The last column shows index between the last and the first year.
--3. Sales Team insights
--3-1 JOIN SalesTeam table with Orders table
CREATE OR ALTER VIEW vwOrderMgrY AS
SELECT
  o.Order_Date AS OrderDate,
  o.Sales,
  o.Quantity,
  s.Sales_Team_Manager AS Manager
FROM tblOrders AS o
LEFT JOIN tblSalesTeam AS s
ON o.Sales_Rep=s.Sales_Rep

SELECT * FROM vwOrderMgrY

--3-2-Prepare data source for pivot table
CREATE OR ALTER VIEW vwMgrYSales AS
SELECT
    Manager,
    YEAR(OrderDate) AS OrderYear,
    SUM(Sales*Quantity) AS TotalSales
FROM vwOrderMgrY
GROUP BY Manager, YEAR(OrderDate)

SELECT * FROM vwMgrYSales

--3-3-Get distinct years for Pivot table columns
SELECT DISTINCT(OrderYear)
FROM vwMgrYSales
ORDER BY OrderYear

--3-4-Create Pivot table
CREATE OR ALTER VIEW vwPivotMgrYear AS
SELECT * FROM vwMgrYSales
PIVOT(
  SUM(TotalSales)
  FOR OrderYear
  IN(
    [2014], [2015], [2016], [2017]
  )
) AS PivotSalesByMgrY

--3-5-Format values properly
SELECT
  Manager,
  FORMAT([2014], '#,0') AS '2014',
  FORMAT([2015], '#,0') AS '2015',
  FORMAT([2016], '#,0') AS '2016',
  FORMAT([2017], '#,0') AS '2017',
  CAST([2017]/[2014]*100 AS int) AS [Index 2017/2014]
FROM vwPivotMgrYear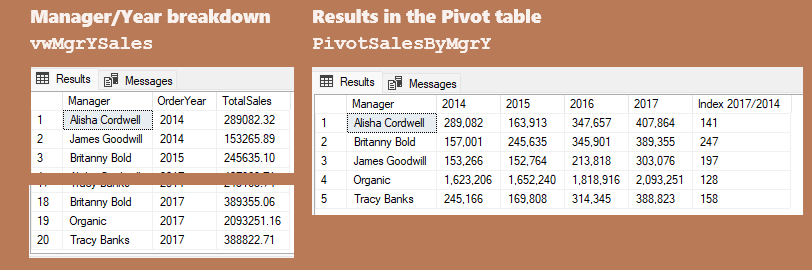
4-Running total of profit year wise for each product category
This question was answered using Window functions.
--4. Get running total of profit per year for each product category
--First join Products with Order
CREATE OR ALTER VIEW vwOrderProducts AS
SELECT
  YEAR(o.Order_Date) AS OrderYear,
  o.Profit,
  p.Category
FROM tblProduct	 AS p
RIGHT JOIN tblOrders AS o
ON o.Product_ID=p.Product_ID

--Profit breakdown by Category and OrderYear
CREATE OR ALTER VIEW vwProfitYearwise AS
SELECT
  Category,
  OrderYear,
  SUM(Profit) AS Profit
FROM vwOrderProducts
GROUP BY Category, OrderYear

SELECT * FROM vwProfitYearwise ORDER BY Category, OrderYear

--Running profit Aggregate window function & Save to the local temporary table
SELECT
  Category,
  OrderYear,
  Profit,
  SUM(Profit) OVER (PARTITION BY Category ORDER BY OrderYear) AS RunningProfit
INTO #tblRunningProfit
FROM vwProfitYearwise

SELECT
  Category, OrderYear,
  FORMAT(Profit, '#,0') AS ProfitInY,
  FORMAT(RunningProfit, '#,0') AS RunningProfitByY
FROM #tblRunningProfit

--Using CTE to Express running profit as Index between the last and the first year
WITH CTE_MaxRP
AS
(
SELECT *,
  CAST(RunningProfit*100/MIN(RunningProfit) OVER (PARTITION BY Category ORDER BY OrderYear) AS int) AS Idx2014
FROM #tblRunningProfit
)
SELECT Category,
  MAX(Idx2014) AS Idx2014max
FROM CTE_MaxRP
GROUP BY Category
ORDER BY Idx2014max DESC
5-Top delivery destinations
This question was answered using Inline Table-valued function, stored procedure, temporary table and WHILE loop.
--5-Top 5 cities with the highest order volume, for each year
--Join Locations with Orders
CREATE OR ALTER VIEW vwOrderCities AS
SELECT
  L.City,
  O.Order_ID,
  YEAR(O.Order_Date) AS OrderYear
FROM tblLocation AS L
RIGHT JOIN tblOrders AS O
ON O.Location_ID=L.Location_ID

--Inline TVF gets either particular year or calculates for all years
CREATE OR ALTER FUNCTION fnTopDeliveries(@TopCount int, @Year int=NULL)
RETURNS TABLE
AS
RETURN
(
  SELECT TOP(@TopCount)
    City,
    COUNT(Order_ID) AS Deliveries
  FROM vwOrderCities
  WHERE OrderYear = CASE
            WHEN @Year IS NULL THEN OrderYear --when year not passed, return all records
            ELSE @Year
            END
  GROUP BY City
  ORDER BY COUNT(Order_ID) DESC
)

--Creating temporary table that contains years
DROP TABLE IF EXISTS #tblDistinctYears
SELECT DISTINCT(OrderYear) AS YearOfOrder
INTO #tblDistinctYears
FROM vwOrderCities
ORDER BY YearOfOrder DESC

SELECT * FROM #tblDistinctYears
ORDER BY YearOfOrder

--Creating stored procedure that loops through all years
CREATE OR ALTER PROCEDURE spTopDeliveries
AS
BEGIN
DECLARE @CursorID int = 1
DECLARE @RowCnt int = 0
SELECT @RowCnt = COUNT(0) FROM #tblDistinctYears

WHILE @CursorID <= @RowCnt
  BEGIN
      DECLARE @OrdYear int = 0;
        WITH MyCte AS
    (
      SELECT  YearOfOrder,
          RowNum = ROW_NUMBER() OVER ( ORDER BY YearOfOrder )
      FROM     #tblDistinctYears
    )
    SELECT  @OrdYear=YearOfOrder
    FROM    MyCte
    WHERE   RowNum = @CursorID

    SELECT @OrdYear AS Year, * FROM fnTopDeliveries(3, @OrdYear)

    SET @CursorID = @CursorID + 1
  END
END

--Exec inline TVF with default param for all years
SELECT 'All years' AS Year,* FROM fnTopDeliveries(5,DEFAULT)

--Exec stored procedure that calls TVF for each year
EXECUTE spTopDeliveries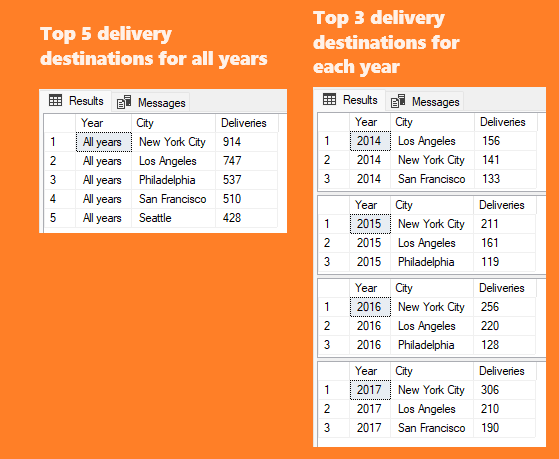
*** THANK YOU! & Have a nice day :) ***